Annotation mapping
In this example, we show how to use annotation_mapping().
In scenarios involving datasets with varying annotation levels, only one dataset might be fully annotated, or the annotation quality may differ, with one being more detailed or reliable than the other. The annotation_mapping() function facilitates annotation transfer between datasets through a created mapping, ensuring consistency across annotations.
See also
See Mapping gene expression in space how to use the
MappingProblemfor mapping single-cell to spatial data.See Cell transitions on how to compute and plot cell transitions.
Imports and data loading
import warnings

from tqdm import TqdmWarning

warnings.filterwarnings("ignore", category=TqdmWarning)
warnings.simplefilter("ignore", UserWarning)
warnings.simplefilter("ignore", FutureWarning)

import moscot as mt
from moscot import datasets
from moscot.problems.space import MappingProblem

import numpy as np

import seaborn as sns

import scanpy as sc
The drosophila() dataset is an embryo of Drosophila melanogaster dataset described in [Li et al., 2022] with minimal pre-processing. adata_sc is the scRNA-seq and adata_sp is the spatial dataset.
adata_sc = datasets.drosophila(spatial=False)
adata_sp = datasets.drosophila(spatial=True)
adata_sc, adata_sp
(AnnData object with n_obs × n_vars = 1297 × 2000
     obs: 'n_counts'
     var: 'n_counts', 'highly_variable', 'highly_variable_rank', 'means', 'variances', 'variances_norm'
     uns: 'hvg', 'log1p', 'pca'
     obsm: 'X_pca'
     varm: 'PCs'
     layers: 'counts',
 AnnData object with n_obs × n_vars = 3039 × 82
     obs: 'n_counts'
     var: 'n_counts'
     uns: 'log1p', 'pca'
     obsm: 'X_pca', 'spatial'
     varm: 'PCs'
     layers: 'counts')
Cluster the data
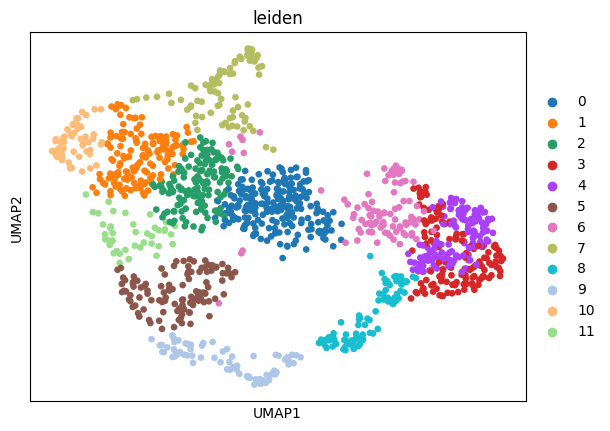
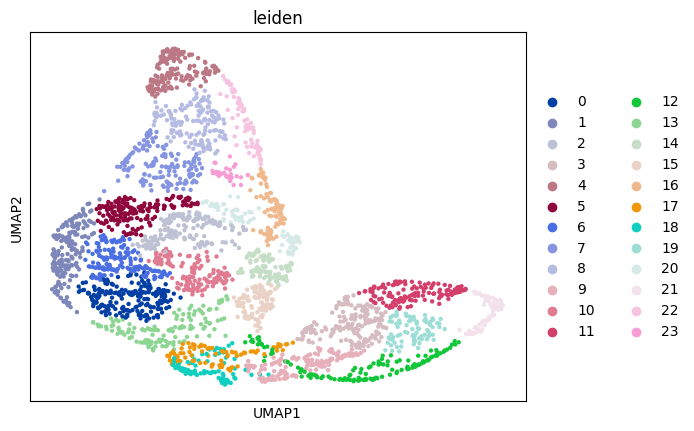
Leiden clustering is a widely-used algorithm for annotating cell types, grouping similar cells based on their gene expression profiles or other relevant features. Here, leiden clusters serve as an effective approximation for cell types or any other group annotations utilized in the analysis.
sc.pp.neighbors(adata_sc)
sc.pp.neighbors(adata_sp)
sc.tl.umap(adata_sc)
sc.tl.umap(adata_sp)
sc.tl.leiden(adata_sc)
sc.tl.leiden(adata_sp)
adata_sc.obs.leiden = adata_sc.obs.leiden.astype("category")
adata_sp.obs.leiden = adata_sp.obs.leiden.astype("category")
sc.pl.umap(adata_sc, color="leiden")
sc.pl.umap(adata_sp, color="leiden")
Prepare and solve the problem
mp = MappingProblem(adata_sc=adata_sc, adata_sp=adata_sp)
mp = mp.prepare(
    sc_attr={"attr": "obsm", "key": "X_pca"}, xy_callback="local-pca"
).solve()
INFO     Computing pca with `n_comps=30` for `xy` using `adata.X`
INFO     Normalizing spatial coordinates of `x`.
INFO     Solving `1` problems
INFO     Solving problem OTProblem[stage='prepared', shape=(3039, 1297)].
Create the annotation mapping of leiden clusters
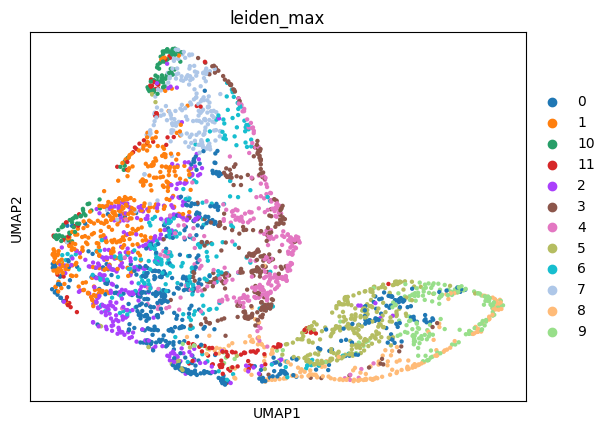
In this case, the target is adata_sc and the source is adata_sp. So, in order to map the leiden cluster annotation from single cell to spatial data, we need to pass forward=False.
First, we create the annotation mapping using “max” mode. This mode transfers the label of the cell with the highest matching probability.
anno_map_max = mp.annotation_mapping(
    "max",
    "leiden",
    source="src",
    forward=False,
    batch_size=256,
)
adata_sp.obs["leiden_max"] = anno_map_max["leiden"].values
adata_sp.obs["leiden_max"] = adata_sp.obs["leiden_max"].astype("category")
sc.pl.umap(adata_sc, color="leiden")
sc.pl.umap(adata_sp, color=["leiden_max"])
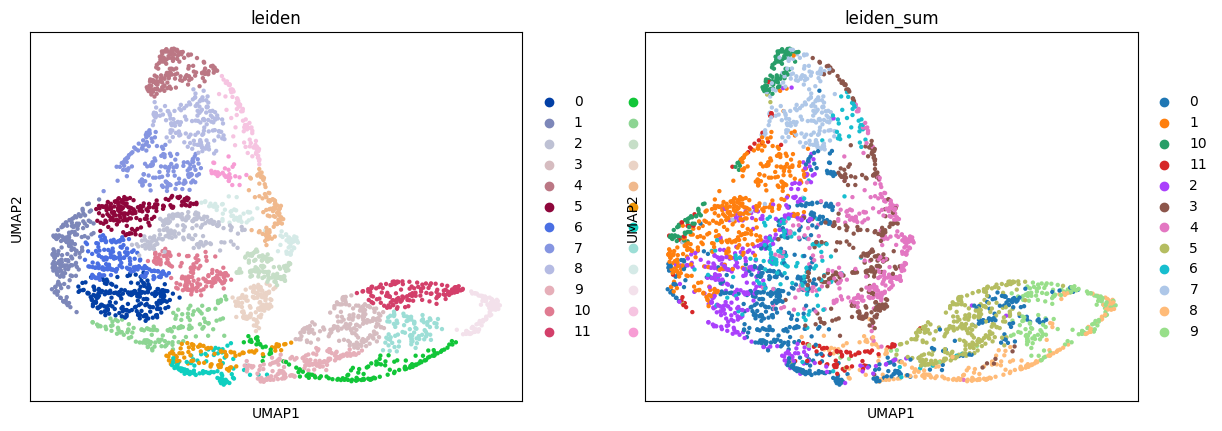
Then, we create the annotation mapping using the “sum” mode. It groups the cells by cell type and transfers the label with the highest total matching probability.
anno_map_sum = mp.annotation_mapping(
    "sum",
    "leiden",
    source="src",
    forward=False,
    batch_size=256,
)
adata_sp.obs["leiden_sum"] = anno_map_sum["leiden"].values
adata_sp.obs["leiden_sum"] = adata_sp.obs["leiden_sum"].astype("category")
sc.pl.umap(adata_sc, color="leiden")
sc.pl.umap(adata_sp, color=["leiden", "leiden_sum"])
Compare the resulting mapping of different modes:
sc.pl.umap(adata_sp, color=["leiden_max", "leiden_sum"])
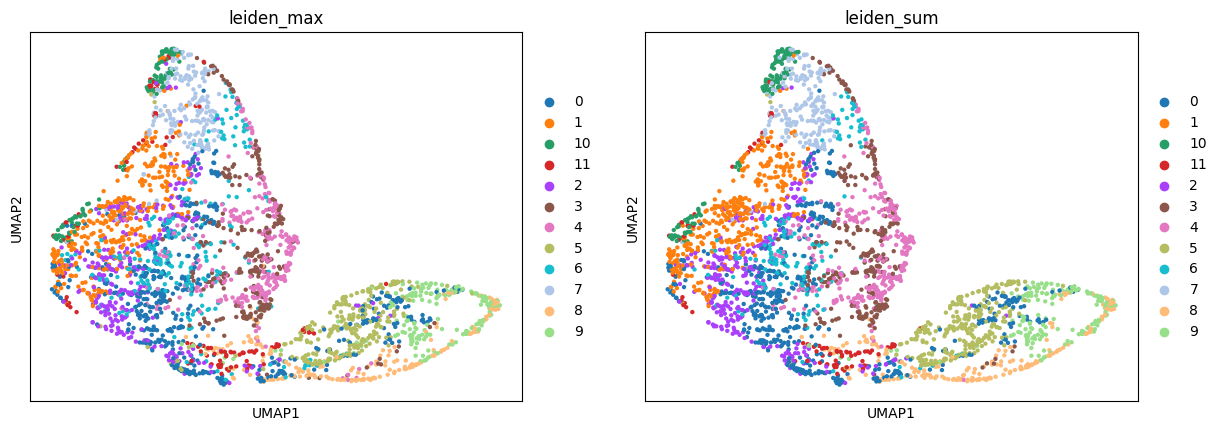
And calculate the fraction of cells that got the same label assigned by "max" and "sum" modes:
adata_sp[adata_sp.obs["leiden_max"] == adata_sp.obs["leiden_sum"]].shape[
    0
] / adata_sp.shape[0]
0.8644290885159592
Around 86% of the cells got the same label in both modes.